The Plot Thickens
Vega
Hugh and Annie
Wed 30 Sep 2015 20:27
| A little while ago we had an email from Chris and Julia - sailing around Greece this summer - with a photo of their chart plotter which was showing them safely moored in the middle of the Acropolis whereas in fact they were downing Ouzos on back of Aremiti in a distinctly watery anchorage some distance away. Actually it wasn’t the Acropolis but the plotter was showing a completely false dry land location. This happens to coincide with an article in the September edition of Yachting Monthly on the use and pitfalls of chart plotters and our own similar experience navigating up the Rio Gadiana. Most of our route was across dry land and it was a relief to re-enter the river on the way back down - see photos (the squiggly lines are our night anchorage). I once drove all the way from the French coast to Saumur in the Loire valley across fields which was very irritating as it was a brand new satnav but with out of date software that wasn’t aware of the new dual carriageway. Apparently with nautical charts it is all to do with datums, Rasters and Vectors (what else?!). A lot of the world uses a standard datum reference to align geographical information when using GPS. Without this you would need different software for every local datum in use in order to read the information consistently on your plotter. Some countries don’t so when you try and read their chart information with your standard reference there can be a difference between what is shown and where you are in practice (or where your GPS thinks you are in practice). Generally the further off the beaten track you go (countrywise that is) the more careful you have to be. Rasters and Vectors are not quasi religious sects linked to former African presidents but the way in which chart information is organised for the plotter. A raster chart is the equivalent of a photo copy of a paper chart and likely to be accurate. A vector chart, on the other hand, is made up of several electronic layers of information that allow the chart to be much more interactive than a Raster. For example you can turn layers on and off to show more or less chart information as required and much more besides. Greater complexity however can lead to error and as most of us have vector charts as standard we should always have the paper one for reference (and then hope that you can trust your GPS or that you haven’t forgotten the old ways of working out where you are). We have now changed most of the interior light bulbs on Vega to LED “bulbs”. I had feared that LED lighting would be a cold artificial blue white but no, you can hardly tell the difference other than the LEDs are slightly brighter. They do seem to save a lot of power consumption from the batteries.The anchor, tricolour and steaming lights are also LEDs so only the deck level navigation lights (used when motoring so not really a power draining issue) to go LED as and when the existing bulbs pack up. Now, you may think that origami boats were of little practical use and representative of ancient technology. Well, think again, because we are carrying our own origami boat around the world courtesy of Chris (as above) that he printed using his 3d printer. Technology doesn’t get more state of the art than that but there is also a practical use for an origami boat as we discovered in Lagos - see two of the photos below. And finally, given what I have written about chart plotters, I hope you don’t think that we have started taking the overland route between ports. In order to give a reasonably accurate route line on the map you have to send a separate email for each position. After days of little or no internet connection there can be quite a backlog of position updates to email through and I am afraid it is much easier just to email the position of each place we stop at. If I can keep a note of the key positions as we are sailing I will revert to the more accurate route but in the meantime please bear with me on this. 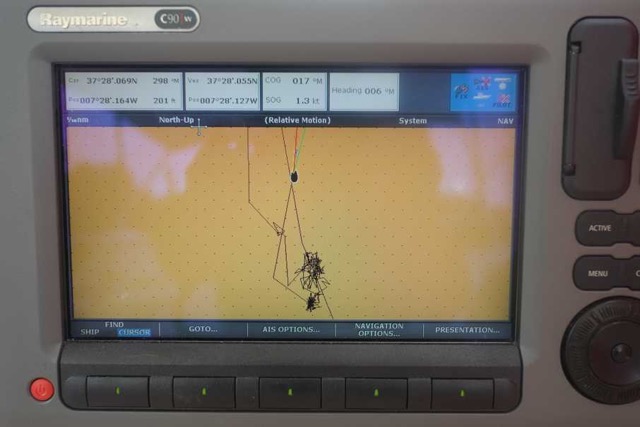 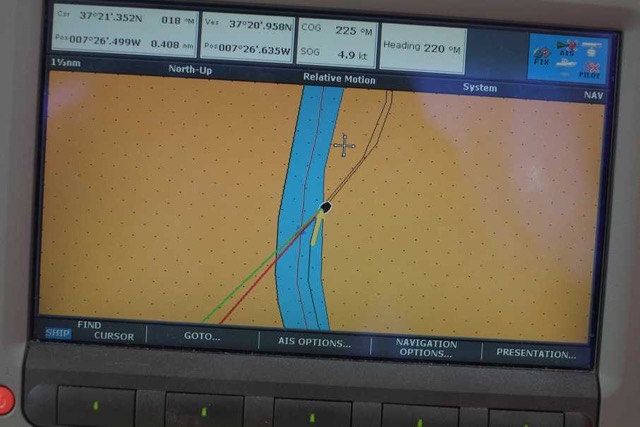 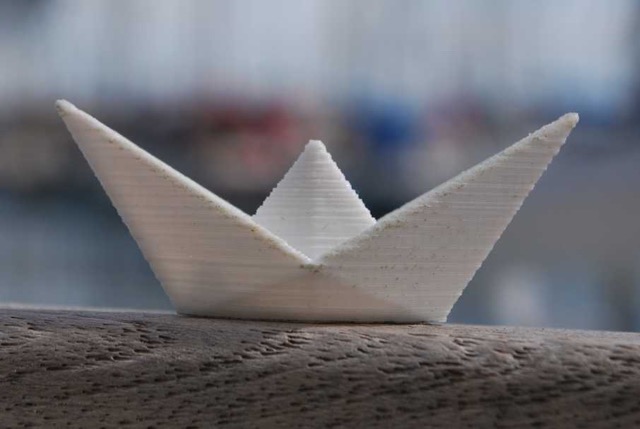 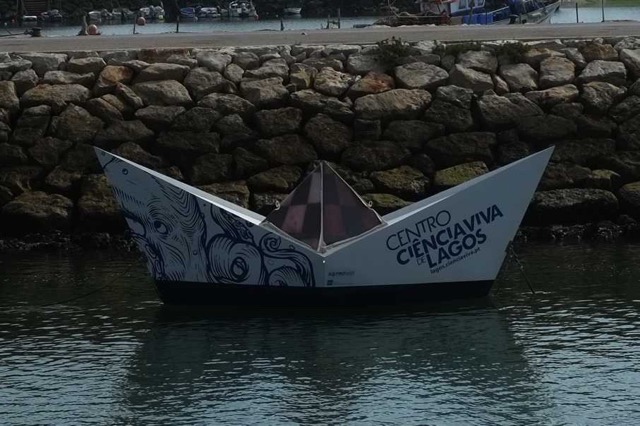 |